Own Workforce
S-1This is large tooltip textRead more
At the heart of our organization is a shared commitment to moving energy together—efficiently, sustainably, responsibly, reliably and with purpose. As we continue to evolve and grow, we recognize that our most powerful asset is our people. Every day, across markets and time zones, they bring our purpose to life. It’s their talent, resilience, and ambition that drive our continued success.
In 2024, we doubled down on this belief with a clear focus: investing in our people so they can achieve their full potential. Because when our people grow, so does our ability to better serve our clients, support our communities, and lead within the energy industry.

Policies related to own workforce
S1-1This is large tooltip textRead more
In a world of continuous change, our People strategy remains focused on agility and long-lasting positive impact. We evaluate and adapt our programs and policies to meet the dynamic expectations of our employees, clients, and stakeholders. This year, we continued to strengthen efforts across six foundational areas.
These priorities ensure that our organization is not only a place where careers thrive but also a place where people feel seen, supported, and valued.
As we continue to navigate and grow in a complex global context, we deliberately ensure that our 2 policies support the professional growth, health, safety, and well-being of our employees.
Processes for engaging with own workforce and workers’ representatives about impacts
S1-2This is large tooltip textRead more
We recognise the importance of two-way dialogues and feedback loops with our workforce, for this reason we facilitate engagement via:
Inputs that arise from these engagements are analysed and the insights of which in turn inform action planning, with senior management, for operational enhancements and cultural improvements.
Processes for engaging with own workforce and workers’ representatives about impacts
S1-3This is large tooltip textRead more
Gunvor ensures that every employee has access to confidential grievance procedures and structured channels for the resolution of workplace concerns. These include:
Each case is tracked, investigated, and reviewed for patterns or systemic issues.
Taking action on material impacts on own workforce, and approaches to managing material risks and pursuing material opportunities related to own workforce, and effectiveness of those actions
S1-4This is large tooltip textRead more
Gunvor continually assesses material workforce-related impacts and opportunities.
Key themes include:
Mitigating actions in 2024 included launching flexible benefits packages, increasing safety training for blue collar workers as well as well-being schemes across our trading offices. We view talent development as a business opportunity, with strategic workforce planning tied to long-term resilient business scenarios.
Targets related to managing material negative impacts, advancing positive impacts, and managing material risks and opportunities
S1-5This is large tooltip textRead more
We remain committed to advancing our Group’s transformation journey, with a continued focus on investing in the attraction, retention, and development of exceptional talent across our global operations. Enhancing the diversity of our workforce across all businesses and functions is a strategic priority, as we recognize its critical role in driving innovation and sustainable growth. In support of leadership excellence, we are implementing the Gunvor Leadership Framework, underpinned by a structured and comprehensive learning and development architecture. Furthermore, we are pleased to announce the onboarding of our first Global Graduate Cohorts, representing a significant step in building a resilient and diverse leadership pipeline for the future.
Characteristics
of the undertaking’s employees
S1-6This is large tooltip textRead more
At Gunvor, we maintain a lean structure which benefits from a highly skilled and multinational workforce that mirrors the complexity of global energy markets.
Historical Headcount
| 2021 | 2022 | 2023 | 2024 | |
|---|---|---|---|---|
| Overall | 1’644 | 1’711 | 1’780 | 1’969 |
| Trading Entities | 790 | 846 | 980 | 1’121 |
| Assets | 854 | 864 | 800 | 848 |
| HEADCOUNT BY CONTRACT TYPE AND GENDER, 2024 | Female | Male | Other | Not disclosed | Total |
|---|---|---|---|---|---|
| Number of employees (headcount) | 557 | 1,394 | 0 | 18 | 1,969 |
| Group Trading Entities | 420 | 683 | 18 | 1,121 | |
| Group Assets | 137 | 711 | 0 | 18 | 848 |
| Permanent contract | 549 | 1,382 | 0 | 18 | 1,949 |
| Group Trading Entities | 414 | 672 | 0 | 18 | 1,104 |
| Group Assets | 135 | 710 | 0 | 0 | 845 |
| Temporary contract | 8 | 12 | 0 | 0 | 20 |
| Group Trading Entities | 6 | 11 | 0 | 0 | 17 |
| Group Assets | 2 | 1 | 0 | 0 | 3 |
| Full-Time | 484 | 1,360 | 0 | 18 | 1,862 |
| Group Trading Entities | 388 | 679 | 0 | 18 | 1,085 |
| Group Assets | 96 | 681 | 0 | 0 | 777 |
| Part-Time | 73 | 34 | 0 | 0 | 107 |
| Group Trading Entities | 32 | 4 | 0 | 0 | 36 |
| Group Assets | 41 | 30 | 0 | 0 | 71 |
| Non-guaranteed hours contract | 0 | 0 | 0 | 0 | 0 |
Accounting principles: The total number of Gunvor Group employees is categorized based on gender and contract type. Gender categories include male and female as well as other genders, which applies to employees who do not identify with their biological gender. Additionally, there is a not reported category for cases where gender information is unavailable. Within this category, employees who have chosen not to disclose their gender in the company’s human resources information system are specifically classified under ‘not disclosed’. Employees’ gender information is recorded based on their own registration in the internal employee management system.
In terms of contract type, employees are classified as either permanent or temporary. Permanent employees hold long-term positions without a predetermined end date in their contracts, while temporary employees are hired for a specific duration, as defined by the end date in their contracts. Temporary employees include those who have signed contracts directly with Gunvor, and do not include non-employees engaged through external providers. Temporary employees include those on fixed-term contracts and interns. Gunvor Group does not employ non-guaranteed hour employees. Additionally, employees are further categorized based on their working hours. Those with a contractual working percentage of 100% are considered full-time employees, whereas employees working under 100% of the standard contractual hours are classified as part-time employees.
| NUMBER OF EMPLOYEES IN COUNTRIES WITH 50 OR MORE | Group Trading Entities | Group Assets | Total |
|---|---|---|---|
| Germany | 1 | 488 | 489 |
| Switzerland | 297 | 0 | 297 |
| Netherlands | 2 | 269 | 271 |
| Estonia | 228 | 0 | 228 |
| USA | 174 | 0 | 174 |
| Singapore | 169 | 0 | 169 |
| Spain | 15 | 91 | 106 |
| UK | 70 | 0 | 70 |
| Turkey | 51 | 0 | 51 |
| Others | 114 | 0 | 114 |
| Non-guaranteed hours contract | 1,121 | 848 | 1,969 |
| HEADCOUNT BY CONTRACT TYPE AND GENDER, 2024 | EMEA | Americas | APAC | Total |
|---|---|---|---|---|
| Number of employees (headcount) | 1,550 | 236 | 183 | 1,969 |
| Group Trading Entities | 720 | 236 | 183 | 1,121 |
| Group Assets | 848 | 0 | 0 | 848 |
| Permanent contract | 1,537 | 235 | 177 | 1,949 |
| Group Trading Entities | 692 | 235 | 177 | 1,104 |
| Group Assets | 845 | 0 | 0 | 845 |
| Temporary contract | 13 | 1 | 6 | 20 |
| Group Trading Entities | 10 | 1 | 6 | 17 |
| Group Assets | 3 | 0 | 0 | 3 |
| Full-Time | 1,447 | 234 | 181 | 1,862 |
| Group Trading Entities | 670 | 234 | 181 | 1,085 |
| Group Assets | 777 | 681 | 0 | 777 |
| Part-Time | 103 | 2 | 2 | 107 |
| Group Trading Entities | 32 | 2 | 2 | 36 |
| Group Assets | 71 | 0 | 0 | 71 |
| Non-guaranteed hours contract | 0 | 0 | 0 | 0 |
Accounting principles: Gunvor operates in 20 locations across 19 countries, with 50 or more own-workforce employees in 9 of these countries. The number of employees in other locations has been consolidated under the ‘Others’ category. The geographic distribution of employees is calculated by aggregating the total headcount of employees within the specific geographical locations where our entities are located. This calculation is based on the end of the reporting period.
Additionally, headcount by gender at the end of the reporting period has been presented for the EMEA, APAC, and Americas regions. Employees who have not disclosed their gender information in the Human Resources Information System are categorized under ‘Not Disclosed’.
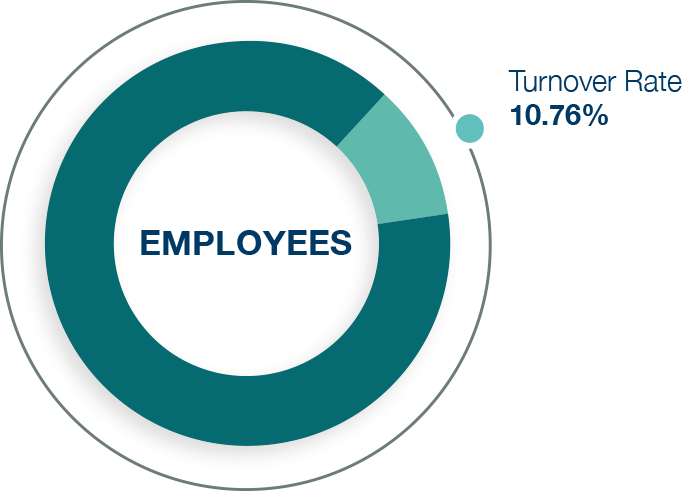
| EMPLOYEE TURNOVER FIGURES 2024 | Total |
|---|---|
| Turnover Rate | 10.76% |
| Group Trading Entities | 14.80% |
| Group Assets | 5.58% |
| Turnover Numbers | 219 |
| Group Trading Entities | 156 |
| Group Assets | 46 |
Employee turnover refers to the total headcount of employees who have left Gunvor Group during the reporting period, while the employee turnover rate represents this figure as a percentage of the workforce. The total number of departing employees is determined by aggregating all exits across our operational countries, excluding non-employees.
Departing employees include those who leave voluntarily, as well as those who exit due to dismissal, retirement, death in service etc. This comprehensive approach ensures that all relevant forms of separation are considered in the calculation.
To calculate the turnover rate, the total number of departing employees is divided by the average number of employees during the same period. The average number of employees is derived by summing the headcount at the beginning and end of the year and dividing by two, ensuring consistency with the annual reporting methodology.
Characteristics of non-employees in the undertaking’s own workforce
S1-7This is large tooltip textRead more
Collective bargaining coverage and social dialogue
S1-8This is large tooltip textRead more
Diversity metrics
S1-9This is large tooltip textRead more
Adequate wages
S1-10This is large tooltip textRead more
Ensuring adequate and fair wages for all our employees is a fundamental part of our commitment to responsible business practices. While we are currently enhancing our data collection and verification processes, we are taking active steps to align with the requirements of ESRS S1-10 regarding adequate wage disclosures. We aim to complete a comprehensive assessment during the current reporting period using set benchmarks based on the EU Directive 2022/2041 and are committed to publishing full disclosures on the adequacy of wages across our workforce starting next year.
Social protection
S1-11This is large tooltip textRead more
As part of our commitment to promoting fair, inclusive, and sustainable employment practices, we are proud to report that our organization covers 100% of our workforce under a comprehensive social protection framework. This framework is designed to ensure that all employees, regardless of their employment status, are provided with essential social protection benefits that align with both legal requirements and the broader principles of corporate responsibility. We believe that social protection is a fundamental element of fostering a supportive and secure work environment, and we are committed to maintaining a high standard of care for our entire workforce.
Our social protection offering covers every aspect of employee well-being, from healthcare to retirement, ensuring that all employees—whether full-time, part-time, permanent, or temporary—are equally entitled to essential benefits. This includes both statutory and voluntary benefits that are designed to meet the specific needs of our diverse workforce. In doing so, we ensure that each employee is afforded the necessary protections against life’s uncertainties, such as health challenges, economic hardship due to unemployment, and the need for caregiving during significant life events.
People with disabilities
S1-12This is large tooltip textRead more
Disability Data Collection
In compliance with the legal requirements outlined in the EU General Data Protection Regulation (GDPR), which applies to all EU member states and EEA countries, as well as similar personal data protection regulations in the various countries where we operate outside of the EU and EEA, we are unable to provide specific reporting on the number of employees with disabilities within our organization. These regulations are designed to uphold the fundamental right to privacy and protect sensitive personal data, including information related to individuals’ health and disabilities.
As a company, we are fully committed to fostering an inclusive and diverse workplace, ensuring equal opportunities for all employees while respecting their privacy and data protection rights. While we may not disclose specific disability-related statistics, we continuously strive to create a supportive and accessible work environment through our inclusion policies, workplace accommodations, and employee support programs.
Training and skills development metrics
S1-13This is large tooltip textRead more
Health and safety metrics
S1-14This is large tooltip textRead more
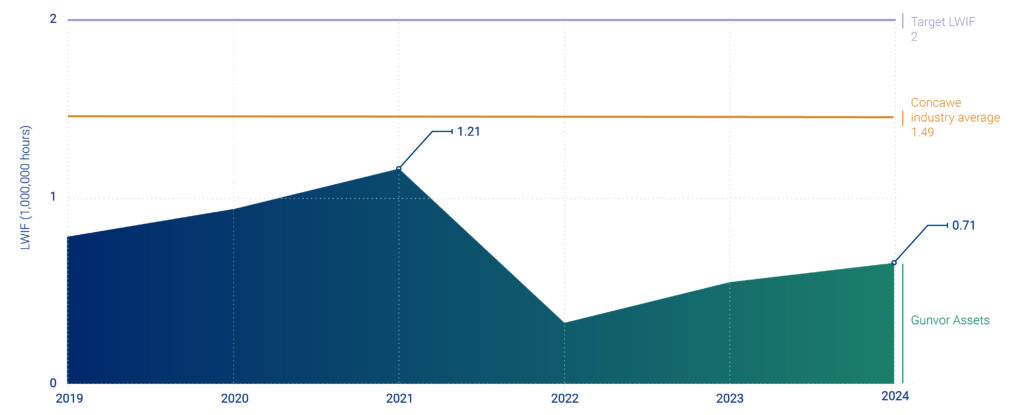
All employees across the company are covered by the Health and Safety Management System. This includes both office-based and site-based personnel. In particular, blue-collar workers at our Group Assets are covered due to specific legal and regulatory requirements that mandate the implementation of comprehensive occupational health and safety measures. We ensure that our health and safety protocols are consistently applied across all operational levels, in alignment with local legislation and corporate policies. We are happy to report that in 2024 no fatalities occurred. Also, nobody suffered significant injuries, meaning that nobody was injured with long term effects with a significant impact on activities or well-being. Our operational sites reported two cases whereby someone was injured to such extent that the person could not return to work the next day (Lost Workday Injury or LWI). The number of LWIs per 1 million workhours is a metric that we compare with the average of the European refining industry which we regard as a suitable benchmark (see graph). It is structurally below our internal and the industry benchmark.
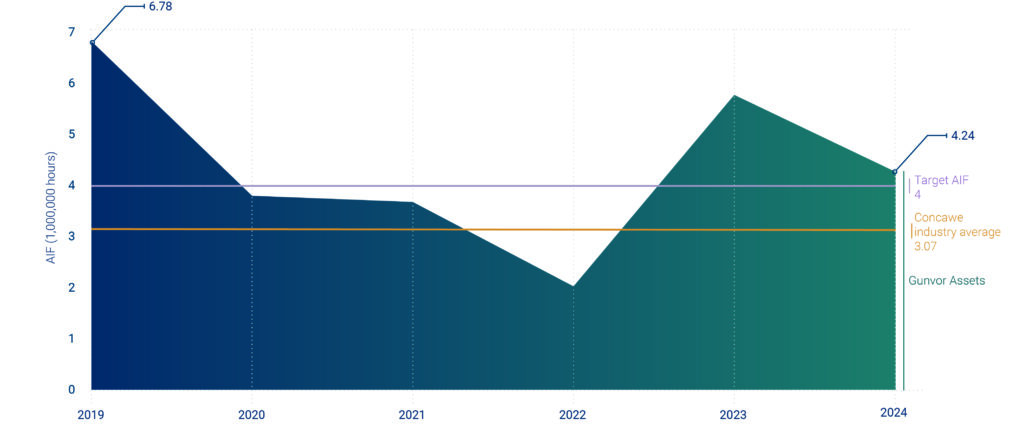
In 2024, our operational sites reported four restricted work injuries (RWI) and six medical treatment cases (MTC). The total number of injuries per million workhours is called All Injury Frequency (AIF). This AIF has improved compared to 2023 but is slightly above our own target and the industry benchmark (see graph). Reviewing the causes of our incidents in 2024 they fall in the common industry and historic causes: ‘Slips, Trips and Falls’ (7 times), ‘Line of fire’ (2 times) and ‘Hitting head’ (2 times). Sites are frequently refreshing awareness for these type of incidents through training, last minute risk analyses and sharing of incidents. As an example, our Ingolstadt refinery deployed an obstacle safety course for all site personnel to raise the awareness for safely navigating on different surfaces, stairs and ladders by practical exercises and conducted a refresher training of our Loss Prevention System.
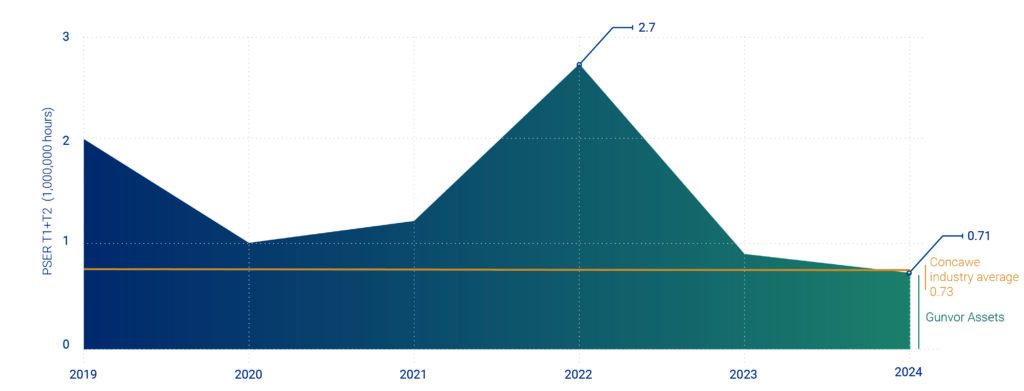
Managing the risks associated with loss of containment with consequences for People, Environment, Assets and Reputation, is extremely important for Gunvor’s processing and storage sites, and this forms a major element of our HSEC governance and procedures. Gunvor measures its performance by recording the process safety events (incidents and near misses) in the categories established by the American Petroleum Institute (Tiers 1, 2 and 3). This institute defines a Process Safety event as an unplanned release of material from a process that results in defined consequences (e.g. significant release, lost time injury, fire/explosion, rain out/discharge to unsafe location, shelter-in-place, evacuation). Tier 1 incidents have more severe consequences than Tier 2. The following graph depicts the number of Tier 1 and 2 incidents per million hours worked (PSER) compared with the average of the European refining industry.
We are proud to report that in 2024 we had no Tier 1 events (zero) and only two Tier 2, which resulted in a PSER which now is below the European Refining Industry average. We remain focused on learning from our events and near misses in order to strengthen our barriers and thus prevent incidents. Initiatives on Gunvor’s Process Safety Improvement List have been reviewed in 2024 and adapted based on Incident and Near-Miss Root Cause Analyses. Applicable initiatives are selected by the sites acknowledging the need for improvement. An example of incident analysis leading to improvement actions is an investigation that took place at our Rotterdam refinery in 2024 following a hazardous release during the shutdown of one of the units. An operator inadvertently opened the wrong valve to drain a piece of equipment. One of the conclusions was that there was unclarity about Process Safety Rules “Do not leave a drain alone” and “Walk the line”. As a follow up the incident was discussed in all shifts, and a refresher training was rolled out regarding the site’s 8 Process Safety Rules.
Work-life balance metrics
S1-15This is large tooltip textRead more
Remuneration metrics
(pay gap and total remuneration)
S1-16This is large tooltip textRead more
As part of our commitment to the European Sustainability Reporting Standards (ESRS) and in preparation for the Corporate Sustainability Reporting Directive (CSRD) implementation, we are taking proactive steps to enhance transparency and equity in our remuneration practices.
Looking ahead, we are committed to ensuring that our remuneration structures not only support the attraction, retention, and motivation of diverse talent but also contribute to our broader sustainability objectives, particularly with respect to equality and inclusion. We aim to fully align our remuneration policies and practices with the requirements set out in ESRS S1-16, including the disclosure of:
We have already begun a comprehensive review of our remuneration policies to ensure alignment with fair wage practices and to reduce unjustified gender-based pay differences.
In addition, we are committed to regularly reviewing, disclosing, and acting on remuneration metrics, including:
These efforts will be complemented by continuous engagement with internal and external stakeholders to promote a culture of transparency, accountability, and inclusivity, ensuring that our remuneration practices contribute positively to social sustainability and long-term value creation.
We recognize that achieving these goals requires ongoing vigilance and improvement, and we commit to disclosing our progress annually, in line with the double materiality principle and relevant ESRS disclosure requirements.
Incidents, complaints and severe human rights impacts
S1-17This is large tooltip textRead more
| DISCRIMINATION INCIDENTS REPORTED AND COMPLAINTS FILED | Group Trading Entities | Group Assets | TOTAL | ||
|---|---|---|---|---|---|
| Discrimination incidents reported | 0 | 1 | 1 | ||
| Complaints filed through channels | 0 | 0 | 0 | ||
| Complaints filed to National Contact Points for OECD | 0 | 0 | 0 | ||
| Amount of fines, penalties, and compensation for damages | 0 | 0 | 0 | ||
| Number of severe human rights issues and incidents | 0 | 0 | 0 | ||
| Cases of non-respect of UN Guiding Principles and OECD Guidelines | 0 | 0 | 0 | ||
| Amount of Fines, penalties, and compensation – relating to severe human rights incidents | 0 | 0 | 0 | ||
Objectives
| 2019 | 2020 | 2021 | 2022 | 2023 | 2024 | Targets | Status* | |||
|---|---|---|---|---|---|---|---|---|---|---|
| % of assets covered by a human rights assessment | 20% | 60% | 100% | 100% | New wave of assessments performed – 100% covered | No new assessment performed | Yearly review – follow up in 2024 | |||
| % of our JVs covered by a human rights assessment | 14% | 29% | 100% | No new assessment performed | ||||||
| Approved remediation plan following human rights assessment | Yes (except ULO) | N/A | ||||||||
| Carry out child labor risk assessment and implementation of mitigation measures | Identification and implementation of mitigation measures: 50% | 100% | 100% | |||||||
| Human rights assessment of strategic suppliers | 2 suppliers assessed | 3 suppliers by the end of 2025 | ||||||||
| *Status is ongoing as targets evolve every year. | ||||||||||